Leverkusen's Performance Analysis 2019-20
- The Analyst Eye

- Aug 1, 2020
- 7 min read
This performance analysis has been made to find out what were the causes for Leverkusen not finishing top 4 this season. To this end, an in-depth performance analysis of eight matches from the 2019-20 season was created. This blog post goes in line with research by Liu et al. (2015), which complements previous research in performance profiling by O’Donoghue (2005; 2010; 2013), regarding situational variables such as the location of the game, strength of the opposition, competition, and the score at half time.
A general performance profile from eight observed games was built, in which four games were against 4 top teams(high) and four middle/bottom teams(low) based on previous campaign end classification. Additionally, games played at home and away were factored while choosing which matches were observed as well as how close the result was.
The Key Performance Indicators, KPIs (Hughes and Bartlett 2002), hereafter, were chosen according to Leverkusen's style of play, and the club's philosophy. Technical and tactical analysis of the team is based on the following: offensive organization, defensive organization, attacking set pieces, defending set pieces, attacking corners, and defending corners (García-López 2008).
To conclude the analysis, recommendations for improvement of the squad are present, which also highlight the weaknesses of the team's performance.


Squad information

Squad Stats
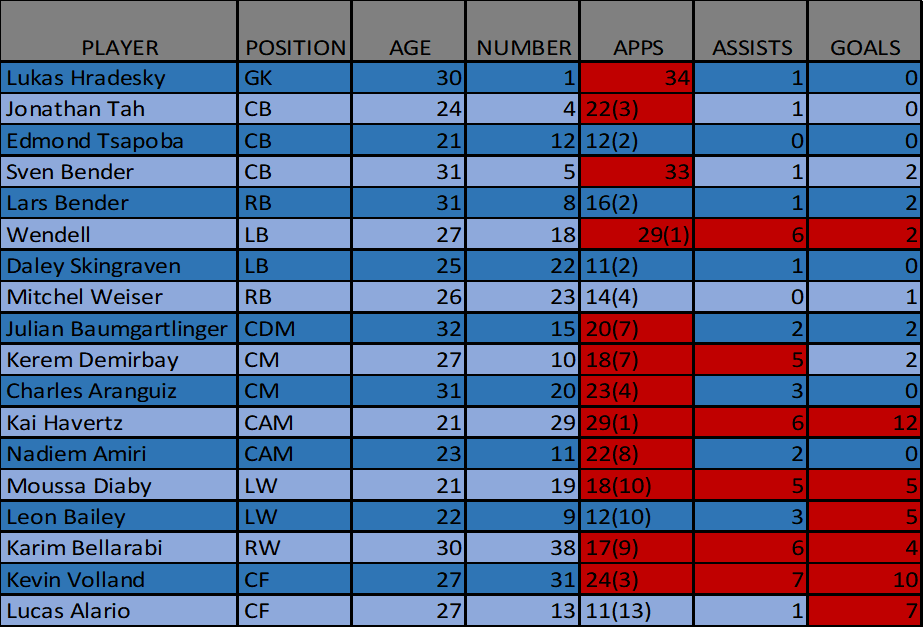
Relevant stats in red such as appearances, assists, and goals.
Games Observed

Top teams- Borussia Dortmund(Home), Fc Bayern München(Away), Borussia Mönchengladbach(Home), Rasenball Leipzig(Away).
Bottom teams- Fc Schalke 04(Home), TSG 1899 Hoffenheim(Away), SC Paderborn 07(Home), and 1.Fc Union Berlin(Away).
Results

Top Teams
Borussia Dortmund(Home) - half time (D), full time (W); Fc Bayern München(Away) - half time (W), full time (W); Borussia Mönchengladbach(Home) – (L), full time (L); Rasenball Leipzig(Away) – half time (D), full time (D).
Bottom teams
Fc Schalke 04(Home) – half time (W), full time (W); TSG 1899 Hoffenheim(Away) – half time (D), full time (L); SC Paderborn 07(Home) – half time (D), full time (W); 1.Fc Union Berlin(Away) – half time (D), full time (W).
Form
5 Wins, 1 Draw, 2 Loses.
Top teams
2 wins, 1 Draw, 1 Loss
Bottom teams
3 wins, 1 Loss
Line ups
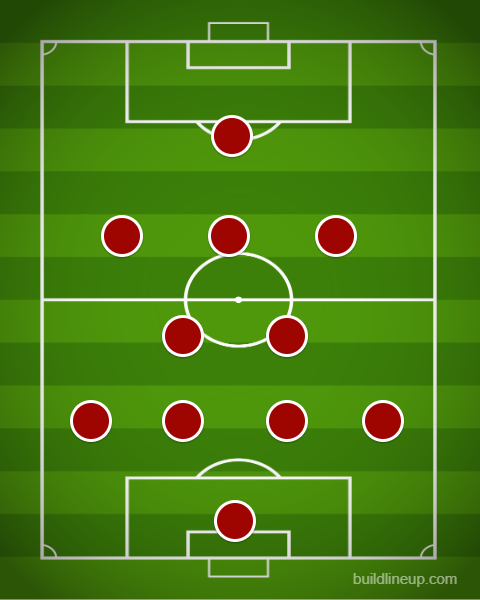
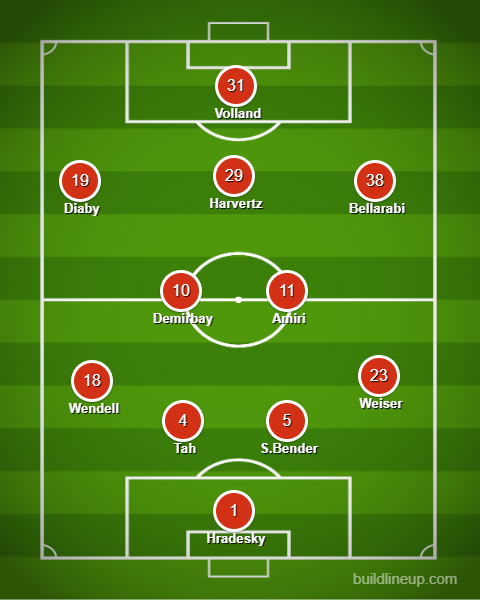
1-4-2-3-1
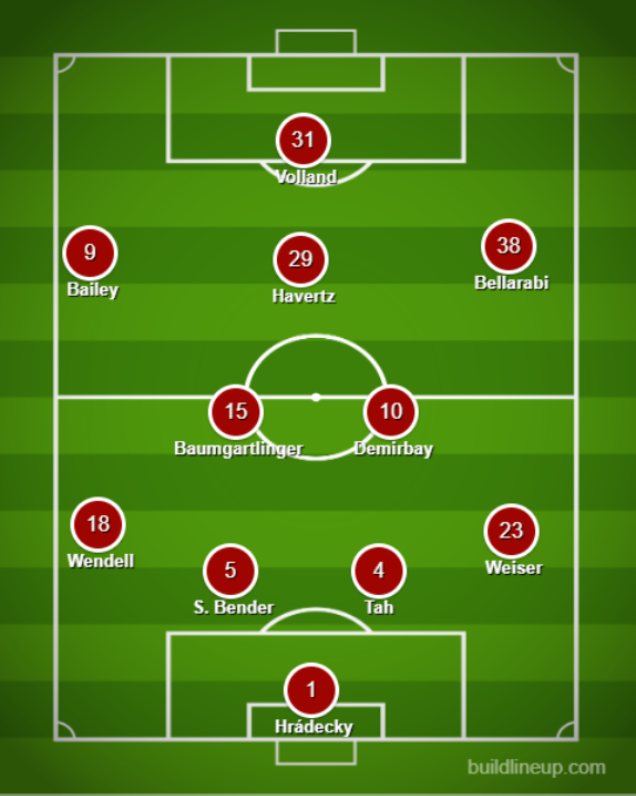
Peter Bosz favored a 1-4-2-3-1 on nineteen occasions as it became the preferred formation
Additionally, this formation can easily be changed to similar ones while keeping the philosophy and style of play.
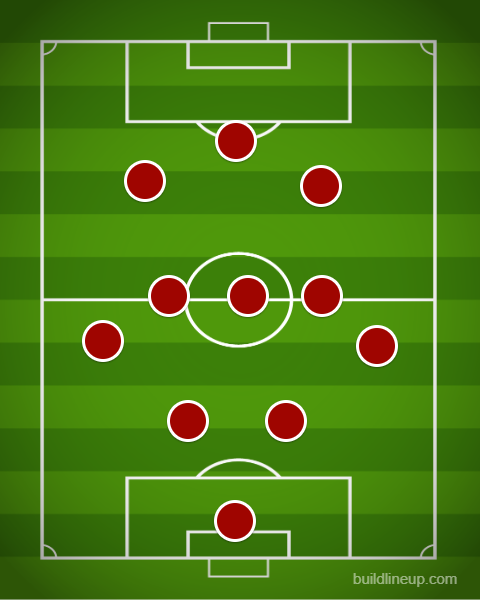
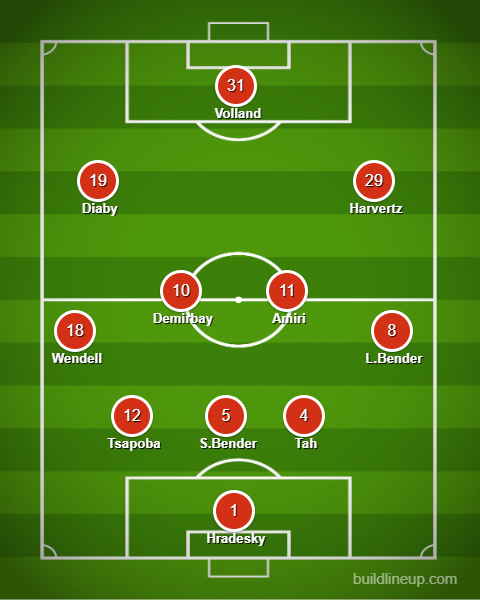
1-3-4-3
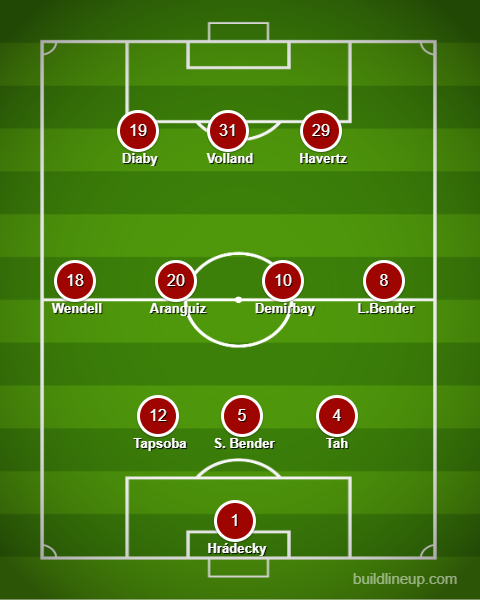
He changed to a 1-3-4-3 on seven times depending on player availability and defensive problems faced.
1-4-1-4-1
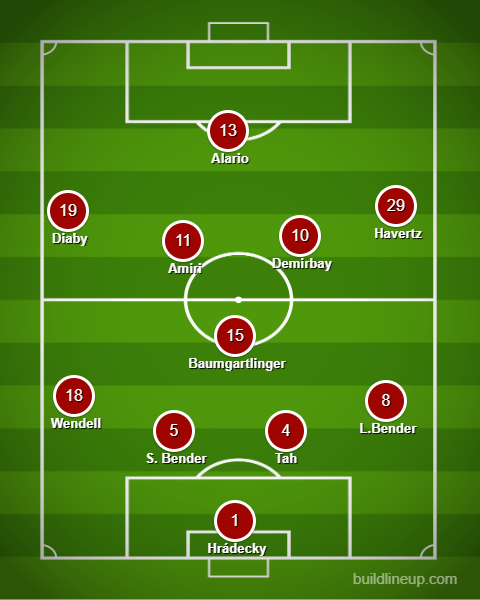
A 1-4-1-4-1 was used on four occasions and still keeping the style of play.
Out of possession formations
1-3-4-3

1-4-2-3-1
1-2-5-3
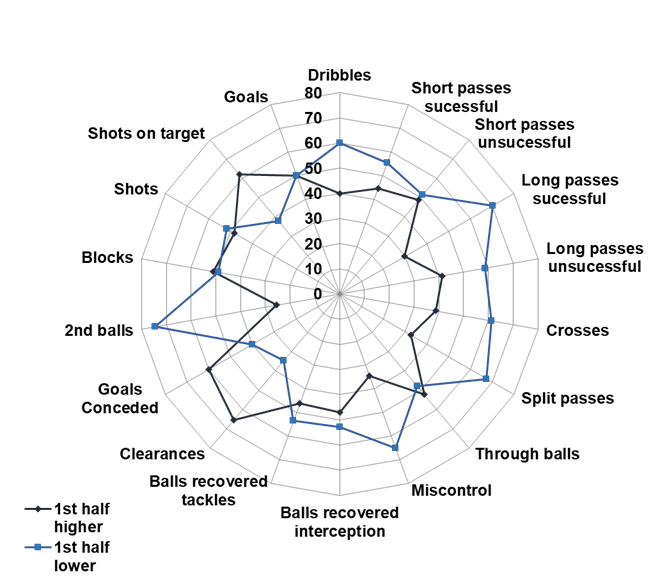
Performance Profiling
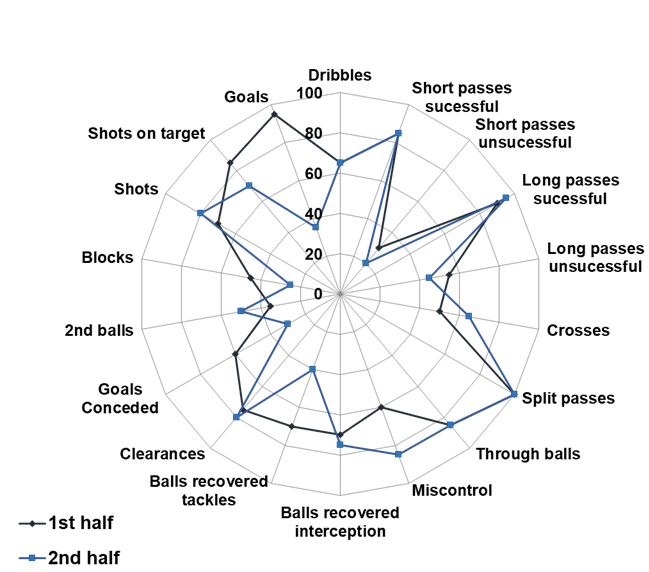
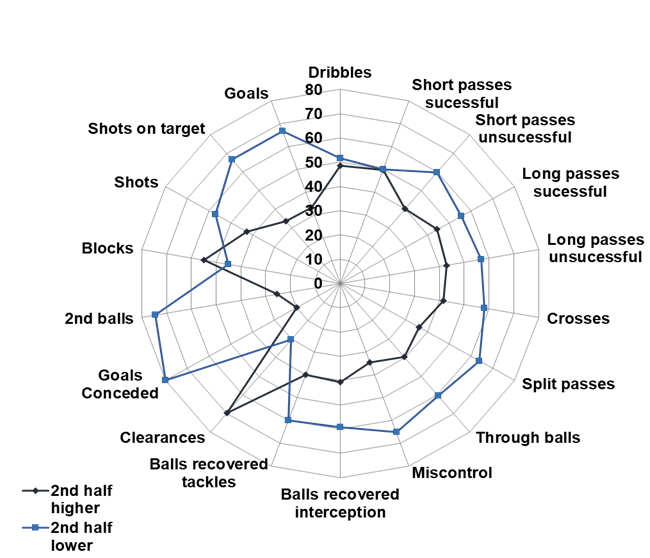
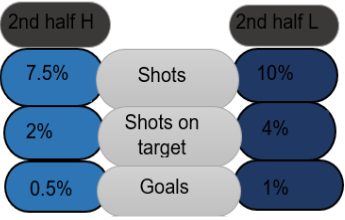
Leverkusen’s performance profile 1st vs 2nd halves.
In this performance profile, there are 3 things that stand out.
There are more shots on target, goals scored and goals conceded in first halves than second ones.
Also, we can look at the poor touches/ball controls by the players on the second halves being greater as it can be due to the match result at half time.
Then, players have a more direct approach to the game and risk more.
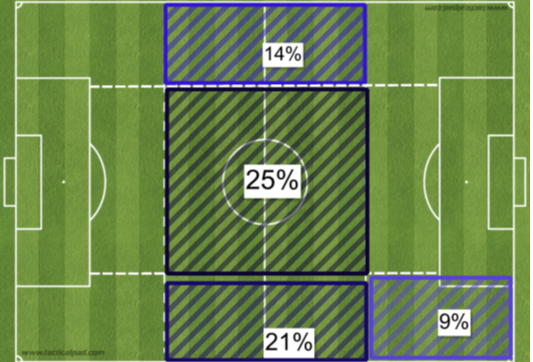
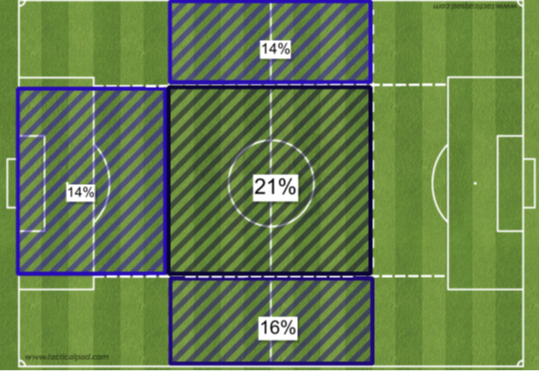
Action zones 4 most played areas
1st Half
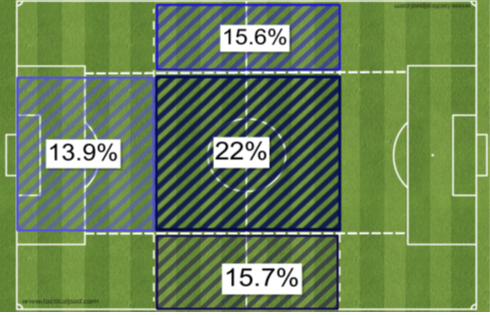
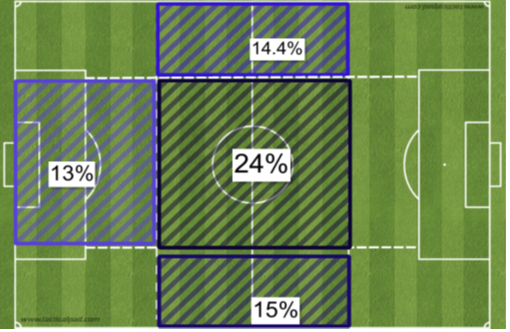
2nd Half
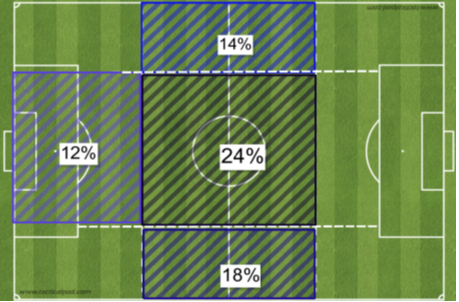
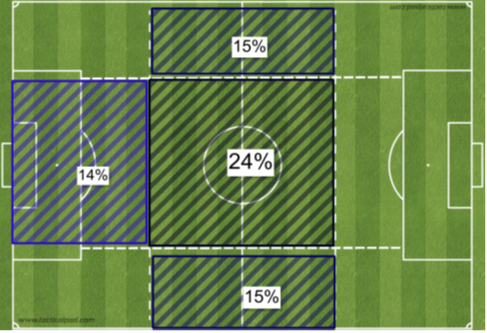
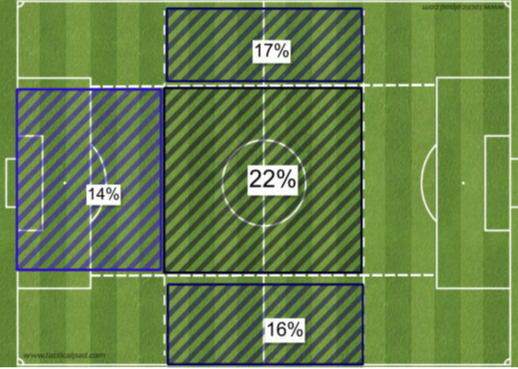
Action zones 1st vs 2nd halves 4 most played areas
Above we can see Leverkusen has a more centralized style of possession, and then make several switches to both left and right side of the midfield. It is visible that Leverkusen does not favor one specific side of the wings but as a consequence of game factors. In general, there was a 4% increase in the usage of the right side of the midfield. Also, Leverkusen used more the central midfield to restart build-up play in the second half compared to the first half.
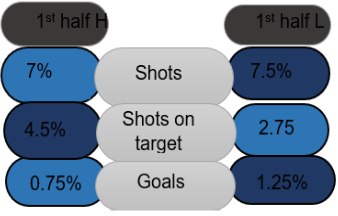
Shooting events
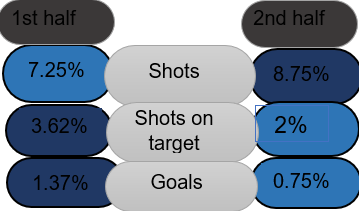
Leverkusen had more shots on the second half, yet they had more shots on target while having fewer attempts, and more goals scored. In other words, they were more clinical in the first half.
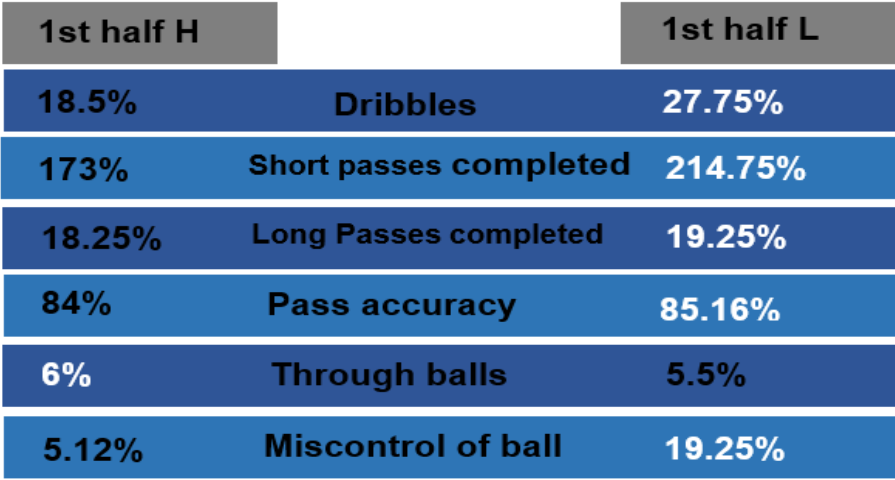
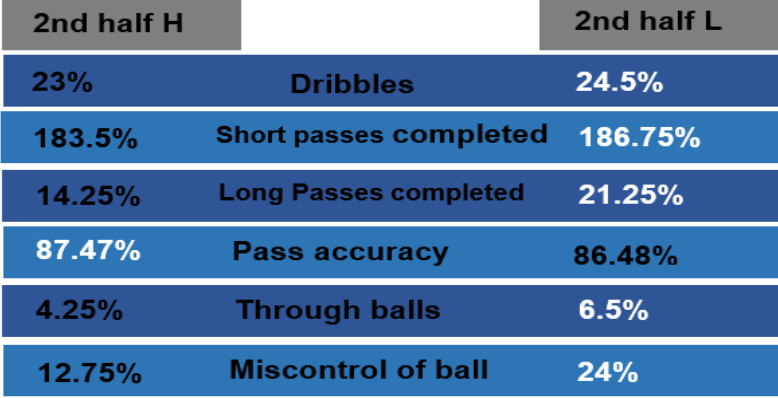
Playmaking events
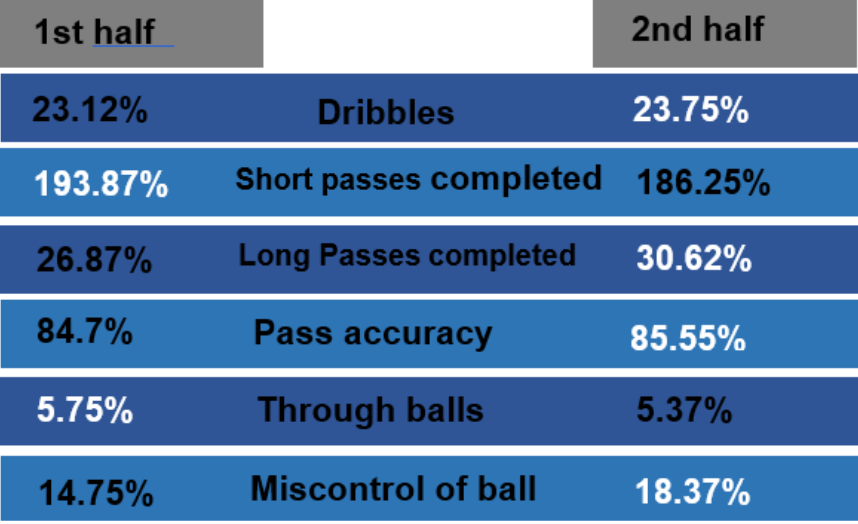
Leverkusen favored a more direct style of play and had relatively more accuracy in passing on the second half.
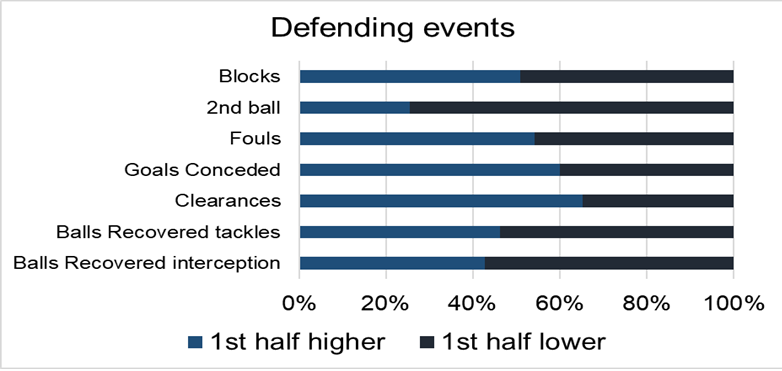
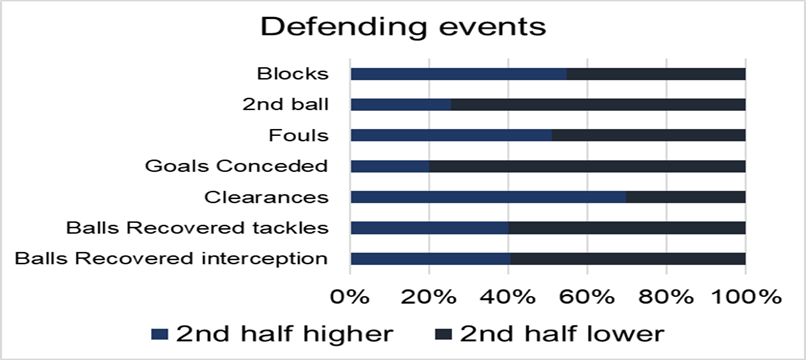
Defending events

Leverkusen had more goals conceded in their first half as well as more ball recoveries by tackles. Overall, Leverkusen's defensive actions were similar throughout the halves.
Half comparison Top vs Bottom teams
1st half
Leverkusen's performance in the first half changes regarding the strength of opposition.
Is it evident that Leverkusen performs better against bottom teams than top teams.
Leverkusen completes more passes, crosses, plays through the opposition lines, wins more 2nd balls, and concedes fewer goals when playing bottom teams.
On the other hand, Leverkusen has more shots on target against top teams.
Action zones 4 most played areas
Top teams
Bottom Teams
The pictures above show that there are not relative changes to areas where Leverkusen plays when facing top and bottom opposition.
Shooting events
Leverkusen has more shots on target against top teams, but more goals scored against the bottom teams.
Playmaking events
As discussed on the team's performance profile, Leverkusen performs better against bottom teams. They have more passes completed and take more risks playing forward.
Defending events
As the graph above shows, Leverkusen conceded more goals against top teams and had more clearances due to the attacking threat of the opposition.
2nd half
Leverkusen's second half is also better against bottom teams, however, they conceded more goals against lower teams.
Action zones 4 most played areas
Top Teams
Bottom Teams
Above we can observe that Leverkusen plays more centrally against both top and bottom opposition. The difference being that against top teams, Leverkusen explored more the right midfield area and also try to play more in the attacking third to the right. A more direct style compared to bottom teams where they played equally in both left and right midfield areas.
Shooting events
Leverkusen had more shots and shots on target against bottom teams. Yet, there is a small increase in the number of goals scored against bottom teams.
Playmaking events
There is a slight change in performance regarding playmaking.
Leverkusen had more passes as well as playing more direct against bottom teams. Nevertheless, there was a slight increase of accurate passes against top teams.
Defending events
As for defensive actions, Leverkusen had more clearances and blocks against top teams due to the attacking threat, however, bottom teams were more clinical as Leverkusen conceded more goals.
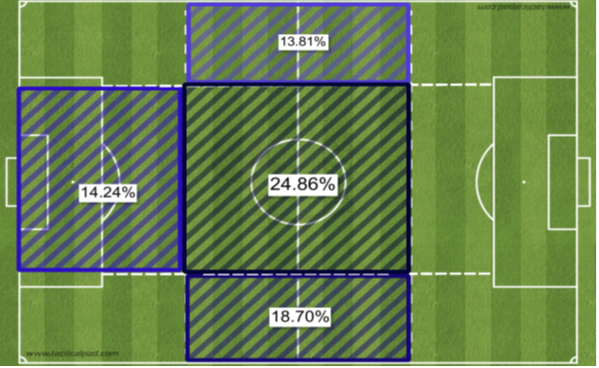
Opposition action zones 4 most played areas
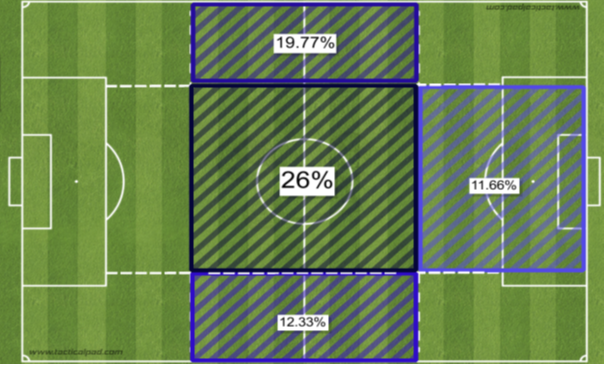
1st half
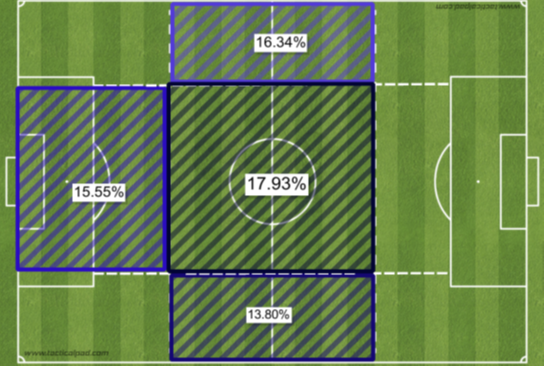
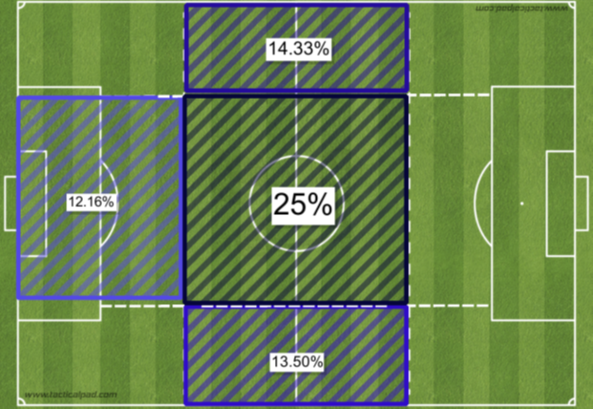
2nd half
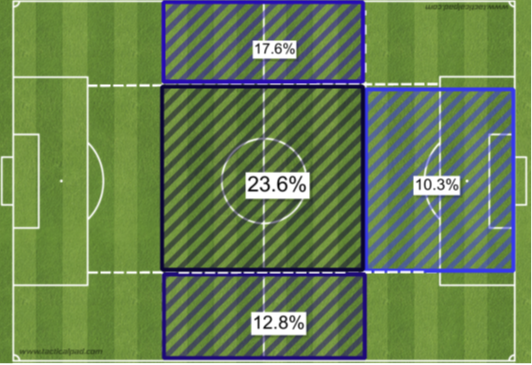
Leverkusen's opposition played more through the midfield with exploring wide areas as well. Interesting to see a change in the second half. Opposition teams explored more Leverkusen's right side with a 5% increase. Also, opposition teams played a lot more in Leverkusen's central defending area.
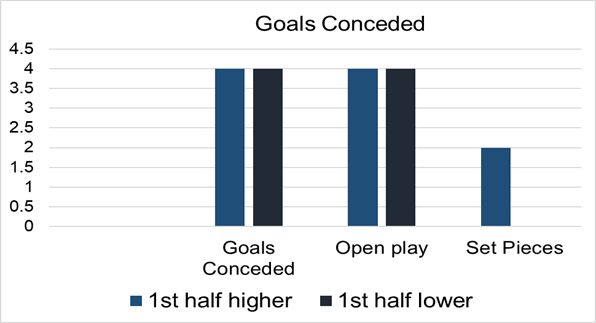
Goals Conceded
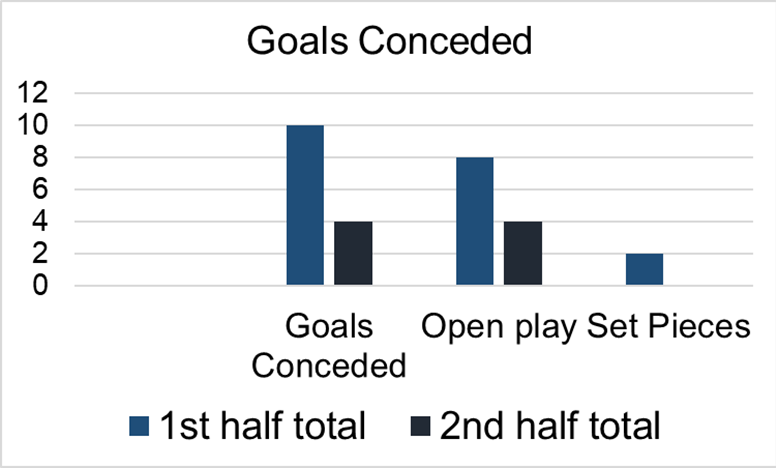
Above we can see that Leverkusen conceded few more goals in the first half than the second one and that most of the goals were from open play. It shows the inability to stop plays while defending.
Half comparison Top vs Bottom teams
Action zones 4 most played areas
1st half Top
1st half Bottom
The opposition teams played more centrally while exploring one of the wide areas of the midfield.
Goals Conceded
Leverkusen conceded goals and type.
2nd half top
2nd half bottom
The opposition played more in the central midfield area, but top teams played more down Leverkusen's right side and also at the defending central area.
Goals conceded
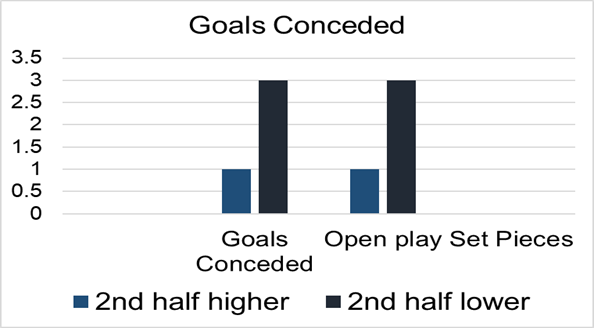
Leverkusen conceded 2 more goals against lower teams, and all of them were from open play.
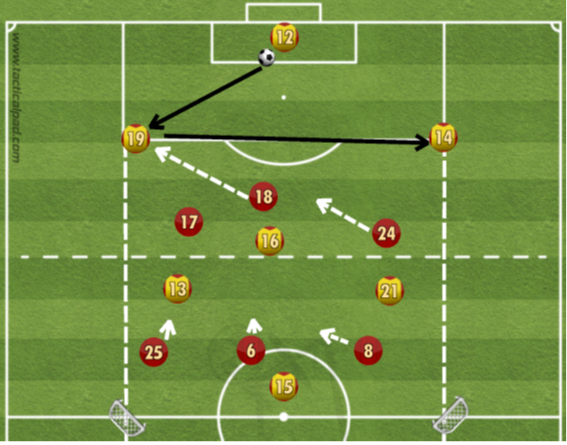
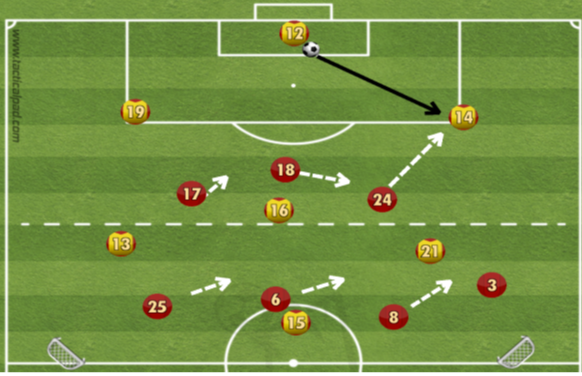
Offensive organization
Build-up play
Possession based style of football
Use of central areas to link play
Attacking down the wide areas and switch through central areas
Through balls
Playing between lines often
CF/AM drops to combine to wide areas
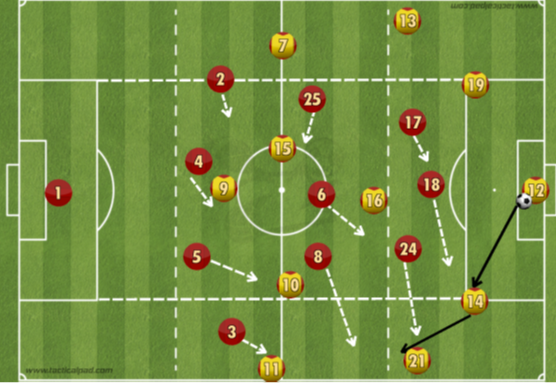
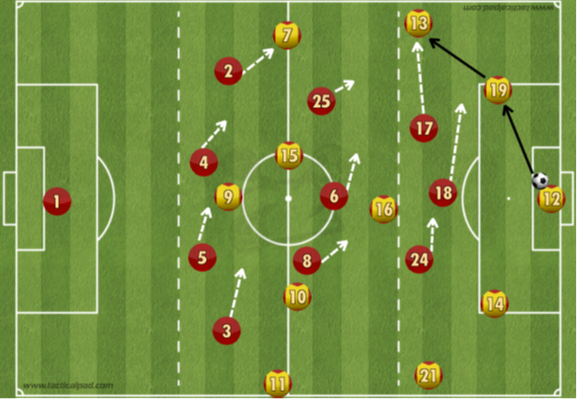
Defensive organization
Forces opponents wide
Trigger press
Changes between 3-4-3, 4-2-3-1 and 2-5-3
A mix of Man-Marking and Zone-Marking
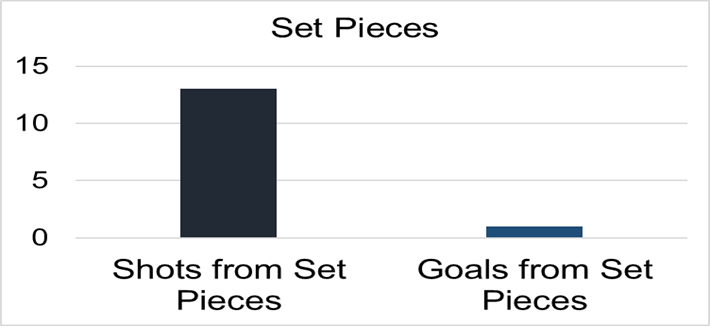
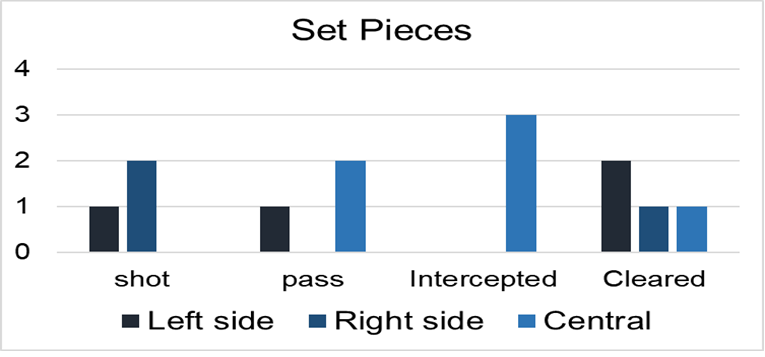
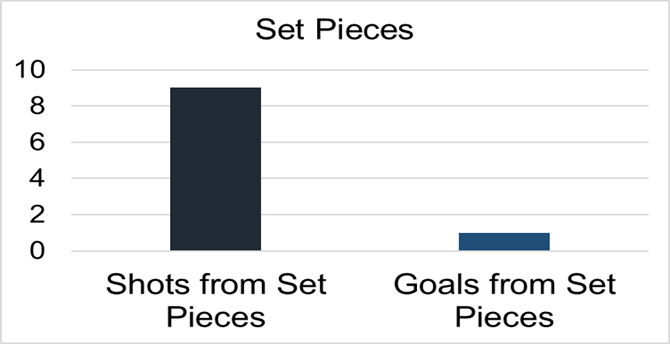
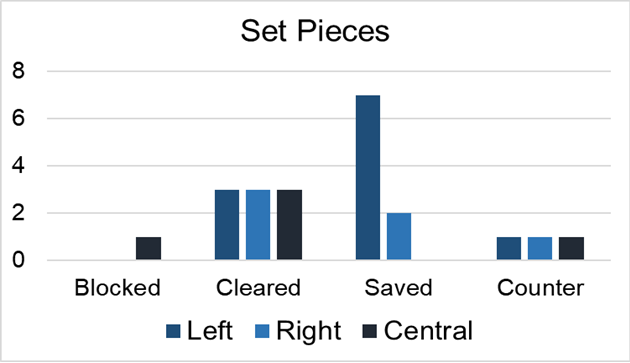
Attacking set pieces
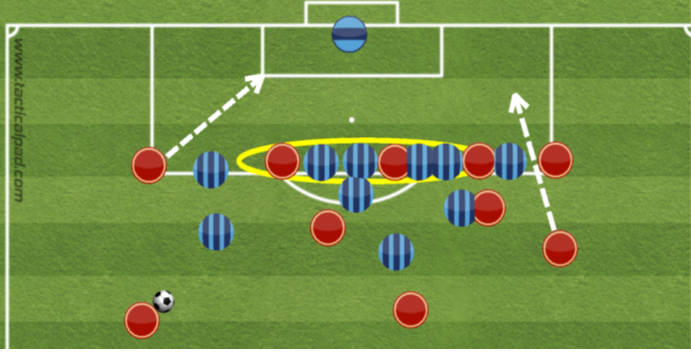
1 player away from the wall to attack space
1 player squeezes inside the wall with the help of a blocker
1 v 1’s at the wall
Defending set pieces
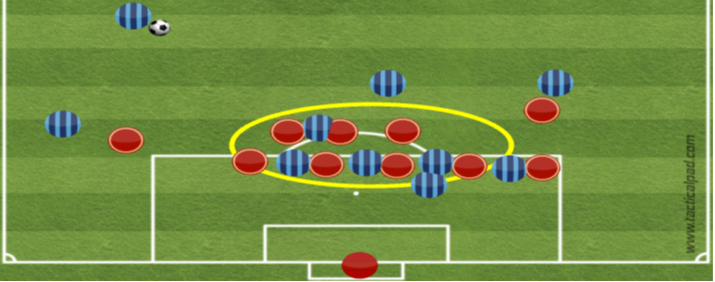
Wall man-marking
1v1’s
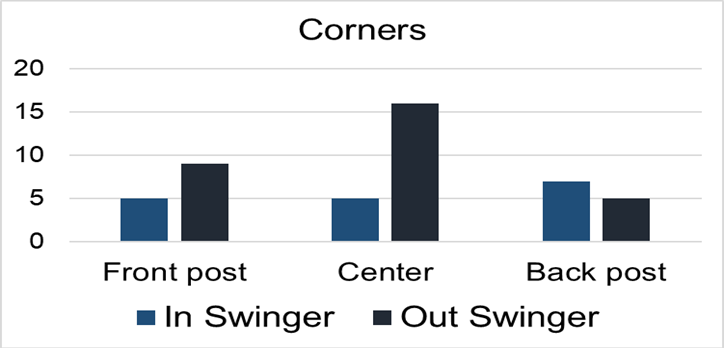
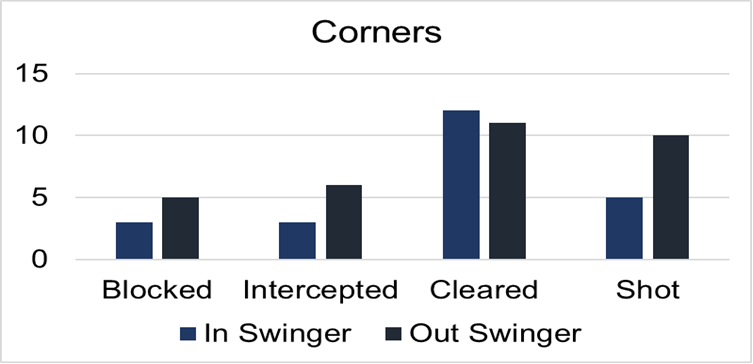
Attacking corners
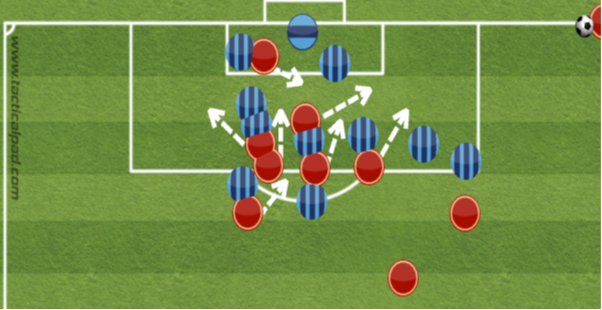
In swinger and out swinger deliveries to 1st post, central, and far post
Players lose markers by running into different directions so a player from behind attacks ball
1 Player stays behind
1v1’s and “train” initial positon then runs to confuse markers and attack desired space
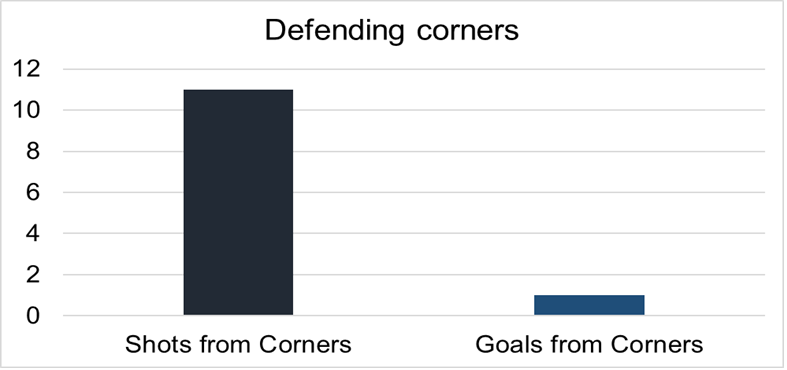
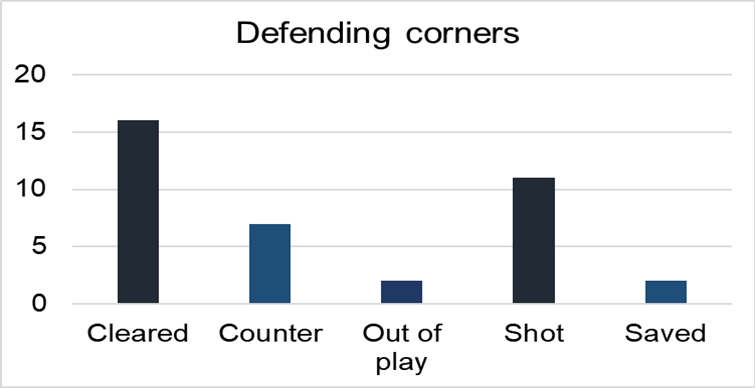
Defending Corners
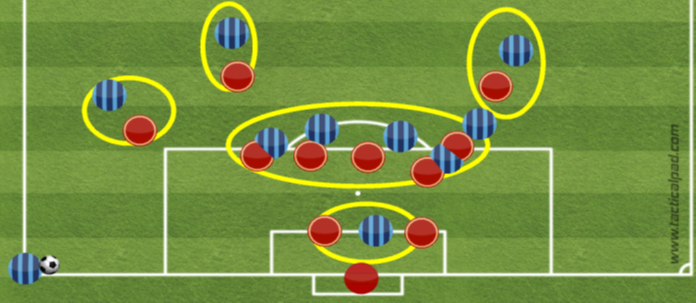
1v1’s marking
Tracking of runners
Inexperience
Lack of communication
Rushing at times
Poor touches and turns in dangerous areas
Poor reactions
Poor positioning at times
Recommended training sessions to improve
Playing out / Build-up play
Playing out difficulties
Poor movement at times
Rushing to play forward
Lack of vision or technical quality
Poor decisions
Slow switches
Practice 1
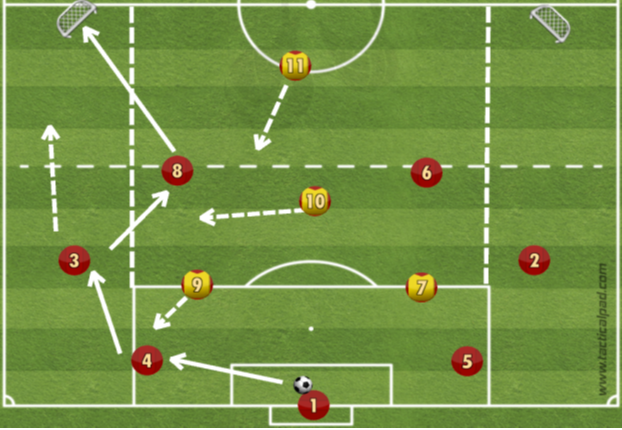
Playing out from the back activity
GK plays to either FB’s or CB’s
Only FB’s allowed on wide areas
The ball goes to CM’s so they can finish in the small goals
Quickplay - Accurate passes - Awareness - Positive 1st touch - Intelligent movement - Creative play - Combination play - Play between lines
Practice 2
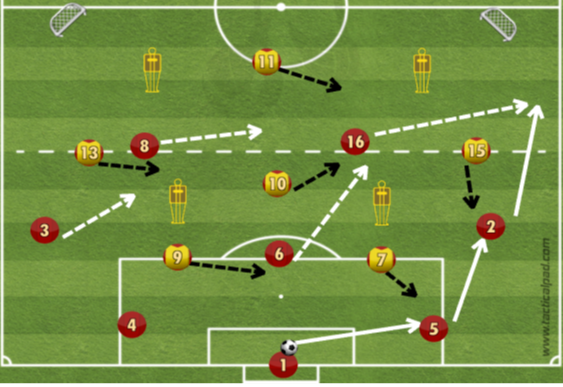
Playing out from the back activity
GK’s play out to FB’s or CB’s
Mannequins block passing lanes
CM’s score on small goals
Quickplay - Accurate passes - Awareness - Positive 1st touch - Intelligent movement - Creative play - Combination play - Play between lines
Practice 3
Playing out from the back activity
Full-size pitch divided into thirds and 3 channels
GK has to play out and the team moving the ball up to the third before scoring
Quickplay - Accurate passes - Awareness - Positive 1st touch - Intelligent movement - Creative play - Combination play - Play between lines
Practice 4
Playing out from the back activity
Full-size pitch divided into thirds
GK plays to FB’s, CB’s or CM’s
The ball moves up the thirds before scoring
Quickplay - Accurate passes - Awareness - Positive 1st touch - Intelligent movement - Creative play - Combination play - Play between lines
Defending sessions
Defending difficulties
Not able to stop play between lines
Allows through balls
Poor positioning at times
Wrong side in relation to ball and goal
Leaves big gaps
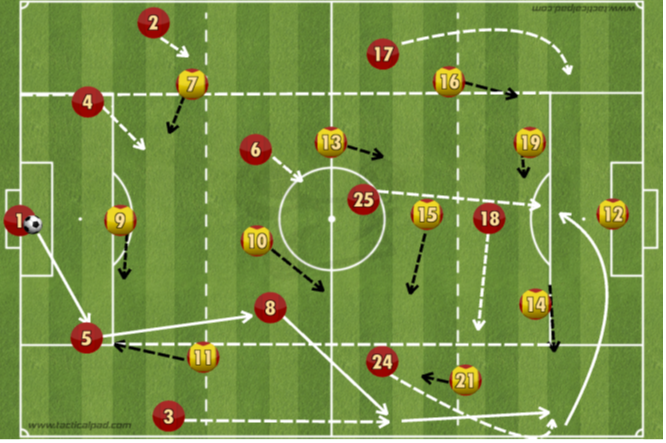
Practice 1
Defending compact/ as a team
Prevent the team in possession to play out from the back
1 player allowed into the wide areas
Shuffle quickly - Force to wide areas - trigger press - compactness - Agility- Recovery runs - communication
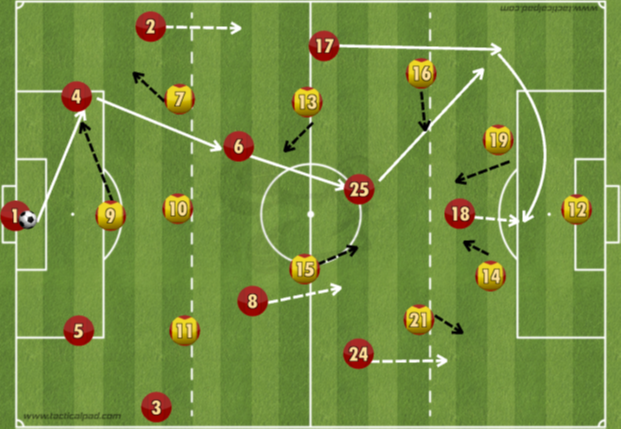
Practice 2
Defending compact/ as a team
Prevent the team in possession to play out from the back
Shuffle quickly - Force to wide areas - trigger press - compactness - Agility- Recovery runs - communication
Practice 3
Defending compact/ as a team
Prevent the team in possession to play out from the back
Full-size pitch divided into thirds and channels
2 players allowed into the wide areas
Shuffle quickly - Force to wide areas - trigger press - compactness - Agility- Recovery runs - communication
Practice 4
Defending compact/ as a team
Prevent the team in possession to play out from the back
Full-size pitch divided into thirds
Shuffle quickly - Force to wide areas - trigger press - compactness - Agility- Recovery runs - communication
Best Line ups
1-4-2-3-1
1-3-4-3


Comments